
Data Center: The Monday That Proved the Arithmetic

A hospital restructured a surgical call contract last week. General surgery, overnight, the acute care work — gone. What remained was elective. Scheduled. The kind of caseload that does not wake you at 2 AM.
Two surgeons received effectively the same news in the same building.
One absorbed it. The other — within 48 hours — had more options than he walked in with.
The data below explains why one outcome was available and the other wasn't.
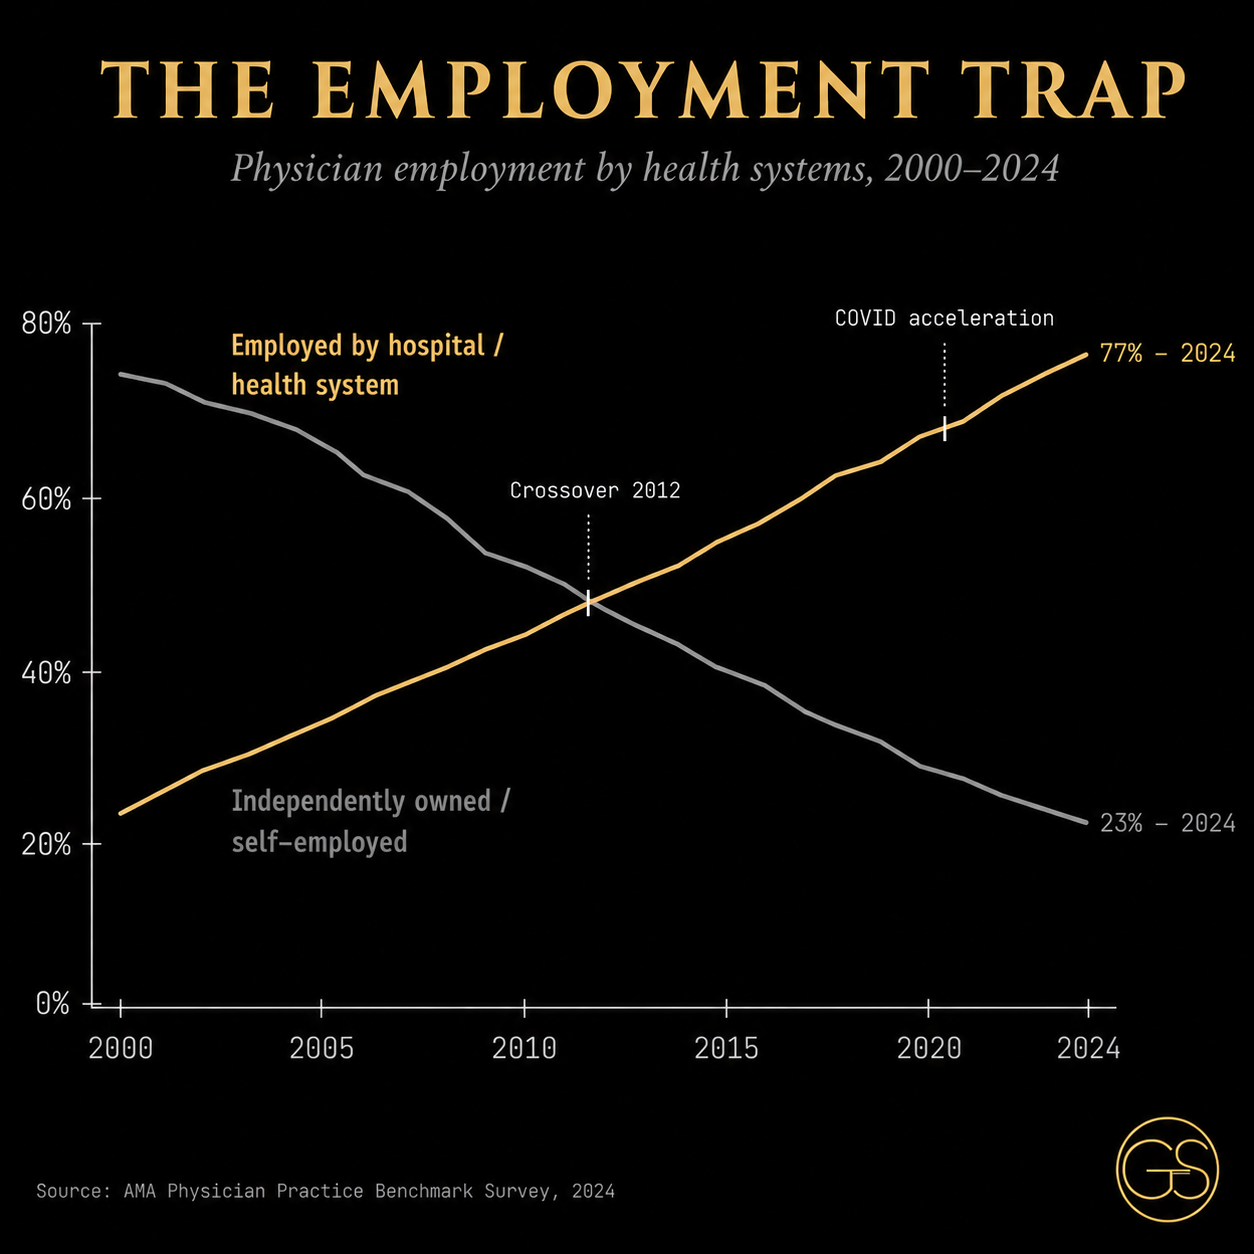
In 2000, 76% of physicians owned their own practice. By 2024 that number had inverted: 77% are now employed by a hospital or health system. The crossover happened around 2012 and accelerated sharply after 2020.
This is not a trend physicians chose. It is a structural shift — health system consolidation acquiring independent practices faster than physicians could defend them. The older surgeon in the corridor built his career inside that trend, the way his generation was told to. He did nothing wrong. The building just didn't come with a side door.
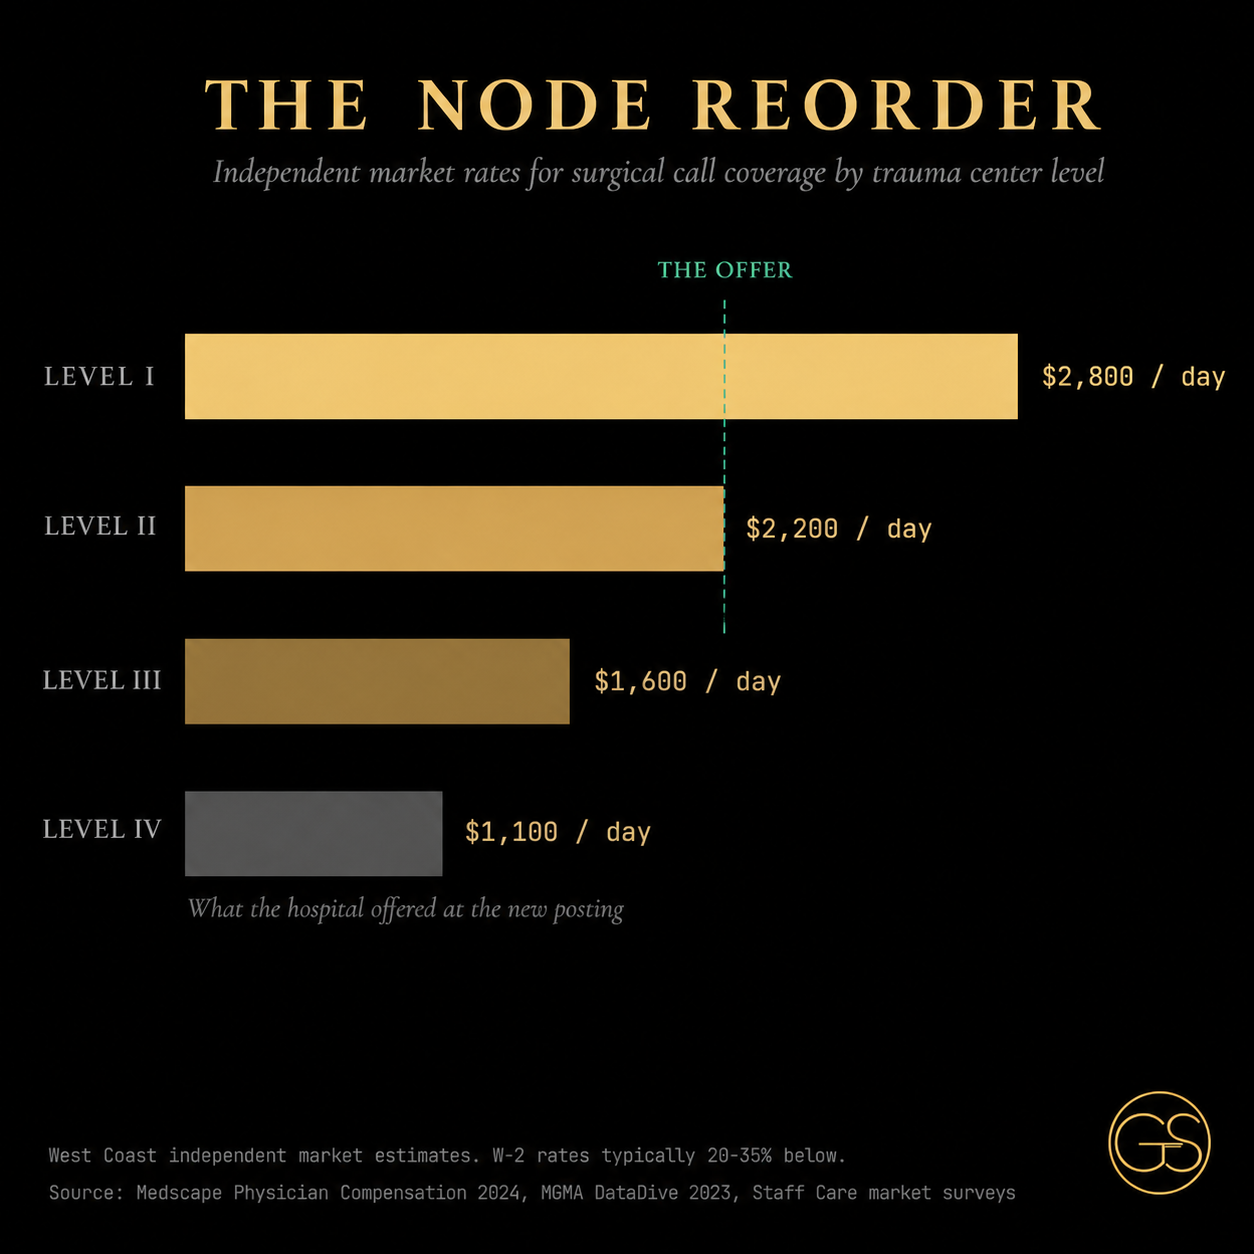
The arithmetic of what the hospital offered is visible in the chart above.
Independent market rates for surgical call coverage are not flat across trauma center levels. They grade directly with acuity, volume, and call burden. A Level II trauma center commands a meaningfully different rate than a Level IV — because the overnight phone, the activation, the clinical weight of what arrives at 3 AM, is different.
When a hospital offers Level II call coverage at a Level IV rate, the difference does not disappear. It transfers from the physician's column to the hospital's. The arithmetic is the same. Only the visibility changes.
The tool above lets you run the calculation yourself. Select a trauma center level and region. The market rate appears. The gap between what the independent market pays and what a W-2 employer typically offers is visible in the delta.
This is not an argument against employment. It is an argument for knowing the number before you sign the contract — or before you accept a restructuring without asking the question.
Sources and methodology
Employment data: AMA Physician Practice Benchmark Survey, 2024. Call coverage rates: Medscape Physician Compensation Report 2024; MGMA DataDive Provider Compensation 2023; Staff Care and Weatherby Healthcare locum tenens market surveys. W-2 rate discount (20–35%) derived from comparison of employed compensation survey data to independent market survey data for equivalent call burden. Regional variation reflects cost-of-living, rural premium, and local market physician supply. All figures estimated ranges, not guaranteed rates. Projected figures (where applicable) noted as such.
THE VAULT holds 12 tools for paid subscribers.
Built for residents who are about to make decisions that will follow them for a decade — and for attendings who wish someone had given them this at the start
FREE TOOLS
Four tools. No email. No catch. Run your numbers and keep them.
Built by a surgeon who wished these existed during training.
The W-2 True Cost Calculator

What is the real cost of an employed physician contract?
Most residents sign their first attending offer without running this number. Most attendings wish they had. Enter a salary, the hours, the weeks. The tool shows what that arrangement is actually worth — and what it costs you that the contract never mentions.
Run it on any offer before you sign it.
The Work Optional Timeline Calculator

The year work becomes optional is not fixed. It is a variable — and you control it.
Most residents never think about this number until they are ten years into an arrangement that was never designed to give it to them. Enter what you will earn, what you will save, what you will spend. The tool returns one number.
The earlier you run it, the more it changes.
The Five Dials Diagnostic

Five dimensions. Twenty questions. One archetype.
For attendings: know where you actually stand before you decide where to go.
For residents: know where you want to go before someone else decides for you.
Most physicians discover their Five Dials score after signing a contract that scores them a zero on autonomy. This takes four minutes. Run it before the offers come.
FREE REFERENCE
The IPM Glossary

21 terms physicians need to know — contract language, business vocabulary, the framework. One page. Built because nobody handed us this at the start.
Work optional. Life intentional.
— Golden Scalpel